Introduction
Insufficient resources for hospital staff is a common issue in many countries. This highlights the importance of management for inpatient care programs. Targeted care programs are vital for critically ill inpatients to prevent suffering and reduce the risk of increased mortality. However, once a patient recovers and stabilizes, it's important to scale back the level of care to alleviate the workload on hospital staff. Medical doctors use patient information and standardized data collection methods to make informed decisions.
The attributes of a hospice ward are similar to those of an intensive care unit, serving as a specialized care ward for terminally ill patients, focusing on palliative treatment. Patients in hospice wards, facing imminent death, require highly complex care. Patients and their families in hospice wards often face not only physical ailments but also frequently experience psychosocial issues. For healthcare professionals, caring for terminally ill patients often involves not only a significant amount of time dedicated to patient care but also the completion of extensive medical records, which can lead to exhaustion. Disparities in care plans also commonly arise due to inconsistencies in communication standards. The Palliative Care Outcomes Collaborative [1], PCOC, is a clinical assessment tool used to measure palliative care outcomes and quality. It was developed and established by healthcare professionals and researchers in Australia. The tool comprises Symptom assessment scale (SAS), the Palliative Care Problem Severity Scale (PCPSS), the Assessment of Patient Functional Status Scale (AKPS), Resource Utilization Groups-Activities of daily living (RUG-ADL), and Palliative Care Phase. These tools help standardize and systematize the assessment of pain, other symptoms, and psychological or psychiatric issues, and facilitate the development of care plans based on the assessment results.
Many hospitals and clinics in Taiwan have implemented the PCOC protocol, with nurses primarily responsible for recording patient data. This includes gathering patient information such as Body Temperature (BT), Pulse Rate (PR), Respiratory Rate (RR), Systolic Blood Pressure (SBP), Diastolic Blood Pressure (DBP), Mean Arterial Pressure (MAP), and nursing assessments in text format. Nurses record numerical data (BT, PR, RR, SBP, DBP, and MAP) three times a day , while skilled nurses also conduct nursing assessments in text format once a day. Hospice ward team members will subsequently examine all the acquired information together and base their decisions on this comprehensive review.
According to a study in Taiwan [2], it was observed that the ratio of care-to-patient is unbalanced. Although the PCOC provides a standardized language for assessment and communication, and can outline the needs of patients, track and respond to their symptoms and issues, the added task of conducting PCOC assessments, combined with the unavoidable medical record documentation, further intensifies the care burden. To reduce the burden on medical staff and doctors, we propose implementing technology that converts text into a pain scale. Our research's primary goal is to decrease the workload of medical doctors and speed up the process of assigning care levels to each patient. Furthermore, this approach can assist ward staff in enhancing their accuracy by offering real-time updates on patient pain scales and care levels.
To validate our proposed model, we will conduct a three-step experiment. The details of each step are outlined below.
- We use pre-trained language models: BERT (Bidirectional Encoder Representations of Transformers) [3], roBERTa (Robustly Optimized BERT-Pretraining Approach) [4], and MacBERT (Masked Language Modeling Correction BERT) [5], to encode nursing assessment text and predict pain scales.
- We comprehensively search for the most suitable machine learning model to predict the pain scale by using patient information such as BT, PR, RR, SBP, DBP, and MAP.
- We utilize ensemble learning with the random forests model to aggregate the prediction outputs and generate the final pain scale prediction.
Related Works
Patient information is critical in healthcare as it plays a fundamental role in treatment decisions and improving patient outcomes. Traditional methods of estimating pain scales rely on human observation, review, and reporting. However, a growing interest is in using machine learning techniques to enhance pain scale estimation. With the help of machine learning algorithms, it is possible to automate the process of pain scale estimation. This section comprehensively reviews the current literature on using machine learning algorithms and artificial intelligence applications in pain scale estimation.
Studies, such as in [6,7], have utilized electronic health information to identify patients suffering from chronic pain. By using available data elements such as pain diagnostic codes (International Classification of Disease, revision 9; ICD-9), patient-reported pain scores, and opioid prescription medications, these studies estimated pain scales. The accuracy of the algorithm's results was validated through medical chart reviews.
Various machine learning algorithms, including decision tree, random forest, Logistic Regression (LR), and Support Vector Machine (SVM), are utilized to classify pain scales based on physiological signals. In study [7], a combination of tree-based models and other machine learning techniques, such as BiLSTM [8], was used to extract features and generate output for XGBoost [9], resulting in high accuracy in predicting pain scales.
Using an SVM and K-nearest neighbor (KNN) to classify pain scales is proved in research such as [10–12]. Machine learning techniques, such as SVM, can classify the pain scale with using two separate feature selection strategies (univariate feature selection and sequential forward selection) during the feature extraction [13]. Similarly, using an SVM model, research [14] identified low back pain based on features extracted from motion sensor data.
Patient chart data is not the only information that can be used to estimate pain scale. A facial image and facial expression are valid indicators of pain [15,16], and they appear in the observational scales for pain assessment. Deep learning approach using convolutional neural networks and facial images was used to estimate the pain scale [17]. The facial expression approach is able to obtain high accuracy in predicting pain scales. However, it is computationally expensive and unsuitable for hospitals with many patients. Moreover, using the facial picture of the patient can raise some privacy concern issues.
Nursing assessment text or clinical note requires an expert to review and label the pain scale for patients. However, text or documents cannot be processed directly using machine learning. NLP is required to process the text or documents before being processed by ML[18].
Transformers [19] are neural network architectures designed to work with text data. It is used as a base architecture for large language models (LLM) and generative pre-trained transformers (GPT) [20]. Text classification uses a transformer encoder to encode text data into context represent vectors. The encoded vector is used as an input to the classification model.
Bidirectional Encoder Representations from Transformers (BERT) [3] is a powerful natural language processing model developed by Google. It uses a transformer architecture to process and understand the context of words in the text. BERT's pre-training and fine-tuning approach helps it to learn language representations and achieve state-of-the-art performance on various NLP tasks. By considering both preceding and following words, BERT captures comprehensive contextual information. Google provides different pre-trained versions of BERT, such as BERT-base and BERT-large. However, fine-tuning with a specific dataset is required for particular tasks or languages. roBERTa [4] applies a new strategy to optimize BERT during training, including longer training time, larger batch size, and dynamic masks. BERT is also capable to process text in languages other than English, which is done in many research. Richardson and Wicaksana [21] compares IndoBERT-lite, built based on the ALBERT (A Lite BERT) architecture, and roBERTA in text mining for Indonesian language question answering application. Nicolae et al. [22] proposed ALR-BERT, a lite Romanian BERT trained on a large corpus solely in Romanian language that scales better than the original Romanian BERT. Alawadh et al. [23] used an Attention-Enriched Mini-BERT to analyze fake news in the Arabic language.
The difficulty to process Chinese text in NLP is significantly higher compared to English text because there are many types of Chinese morphemes, meanings, and complex combinations of words. MacBERT [5] is a transformer-based for Chinese NLP, which proposed the Whole Word Masking (WWM) method to process Chinese vocabulary more accurately. Compared with the original BERT masking method, WWM masks the whole Chinese words to capture the relationship between words better, preserve the complete contextual information, and improve the model's prediction accuracy. In some research, BERT has been used to classify news in Chinese, such as text classification [21,22], tagging in Chinese judicial documents [26], and government policy plan texts [27]. The accuracy of text classification is further increased by combining it with other neural networks.
In practice, estimating the pain scale requires the patient information from a medical device (e.g., Vital Signs) and a description from observation (e.g., nursing assessment text). Existing research used only measured values or clinical notes to predict pain scales. Lin et al. [28] used machine learning techniques to predict a patient’s pain level from the recorded vital signs. In our research, we consider using “Vital Signs” and “Nursing assessment text” as the input for our model. We proposed to create a model to manage each data type, then use ensemble learning algorithm [29] to combine and make a final prediction.
Research Methodology
The traditional pain scale is determined by patient or a doctor and devise an appropriate treatment plan. In this research, our team proposed a novel method to automatically predict a patient’s pain scale. Initially, the method utilizes the BERT system for natural language processing to automatically label the pain scale from PCOC based on text processing. Next, we put vital signs to machine learning model to predict the pain scale. Finally, we ensemble the output of BERT system and vital pain scale. The detail of operation includes (1) setting up the dataset, (2) preparing and preprocessing the collected data, (3) classifying nursing assessment text using the BERT system, (4) generating a vital signs classification model, and (5) creating a Pain Scale Classifier Model (PSC-Model) that uses ensemble learning to merge the BERT system output with vital signs information. We describe the operations as follows.
Dataset
We collected data from patients admitted to the Taichung Veterans General Hospital hospice ward between July 2021 and June 2022. All identifiable patient information are removed to maintain privacy and adhere to ethical standards. The dataset is presented in two parts: nursing assessment text data and vital signs data, each presented in a tabular format.
The first dataset, comprising nursing assessment text, contains the record date, nursing assessment text and the pain scale. The nursing assessment text is filled out in a mix of English and Chinese, with English predominantly used for technical terms and medication names. This dataset features a pain scale that has been carefully reviewed and completed by a licensed medical professional. The scale ranges from 0 to 3, where 0 indicates the need for "Continuing Care", 1 suggests the need for "Continuous Monitoring", 2 suggests the need to "View Care Plan", and 3 indicates the need for "Emergency Handling."
The vital signs dataset contains standard information collected using medical devices such as thermometers and heart rate monitors. It encompasses all the necessary information a nurse must collect during a routine checkup such as body temperature (BT), pulse rate (PR), respiratory rate (RR), systolic blood pressure (SBP), diastolic blood pressure (DBP), and mean arterial pressure (MAP).
Data Preparation and Preprocessing
With the nursing assessment text dataset, we can use NLP and Text Classification models to classify pain scales. However, the vital signs dataset, containing crucial information, requires integration with pain scale data. To address the requirement, the nursing assessment text and vital signs data are merged to form two new datasets. The new datasets encompass all the essential information needed to train our models.
Merged Dataset 1 combines the vital signs data with the corresponding pain scale information derived from the nursing assessment text for the same patient and date. The pain scale in Merged Dataset 1 is adjusted to range between 0 and 2, with pain scales 2 and 3 consolidated into a single category, pain scale 2. This adjustment is made because the actions taken for pain scales 2 and 3 are found to be identical.
Merged Dataset 2 is a combination of the nursing assessment text dataset with the vital signs dataset. We map the value of BT, PR, RR, SBP, DBP, and MAP for the same patient on the same day. The pain scale in Merged Dataset 2 is also rescaled to the range from 0 to 2, ensuring label consistency across datasets. The new merged dataset will have the same number of entries as the nursing assessment text dataset.
Table 1 shows the number of records and data distribution in the datasets. We split the dataset into the training and testing set in an 80:20 ratio. This split was done randomly and in consultation with a doctor. Following the split, the nursing assessment text dataset and Merged Dataset 1 contain 6,636 records for training and 1,654 for testing. Merged Dataset 2 comprises 10,494 records for training and 2,624 for testing.
| Pain Scale | Nursing Assessment Text Dataset | Merged Dataset 1 | Merged Dataset 2 |
|---|---|---|---|
| 0 | 2,256 | 3,879 | 2,256 |
| 1 | 4,785 | 7,584 | 4,785 |
| 2 | 1,120 | 1,655 | 1,120 |
| Total | 8,261 | 13,118 | 8,261 |
Nursing Assessment Text Classification (NTC-BERT)
BERT [3] (Bidirectional Encoder Representations from Transformers) is a cutting-edge machine learning model used for natural language processing (NLP) tasks. It has been pre-trained on 104 languages, including Chinese, using masked language modeling (MLM) on the Wikipedia website. This training approach has enabled BERT to understand the context of documents and encode text documents into a vector.
Our method used mixed language from the Chinese and English languages. The difference between Chinese and English is the word tokenizers, or how they break down the text into individual units or tokens. Although BERT can be fine-tuned for specific tasks, our study did not involve such fine-tuning. Instead, we experimented with various pre-trained versions of BERT, including roBERTa [4] and MacBERT [5], which differ from BERT in their pre-training techniques. As shown in Figure 1, NTC-BERT is a combination of a BERT followed by a linear layer which acts as a classifier. NTC-BERT is trained using the nursing assessment text data. BERT will encode the text data, and the output will go through a fully connected layer to predict the pain scales.

Vital Signs Classification Model (VSC-Model)
To select an appropriate Machine Learning algorithm that can classify pain levels based on data on vital signs. To achieve the objective, we have explored various algorithms, conducting experiments and do hyperparameter tuning to optimize their performance. After testing each model, we analyzed their implementations using the Model Search (MS) framework. Our method allowed us to optimize each model's capabilities and ultimately reach the best performance. The six indices of features are body temperature (BT), pulse rate (PR), respiratory rate (RR), systolic blood pressure (SBP), diastolic blood pressure (DBP), and mean arterial pressure (MAP) which are selected by two doctors based on their domain knowledge.
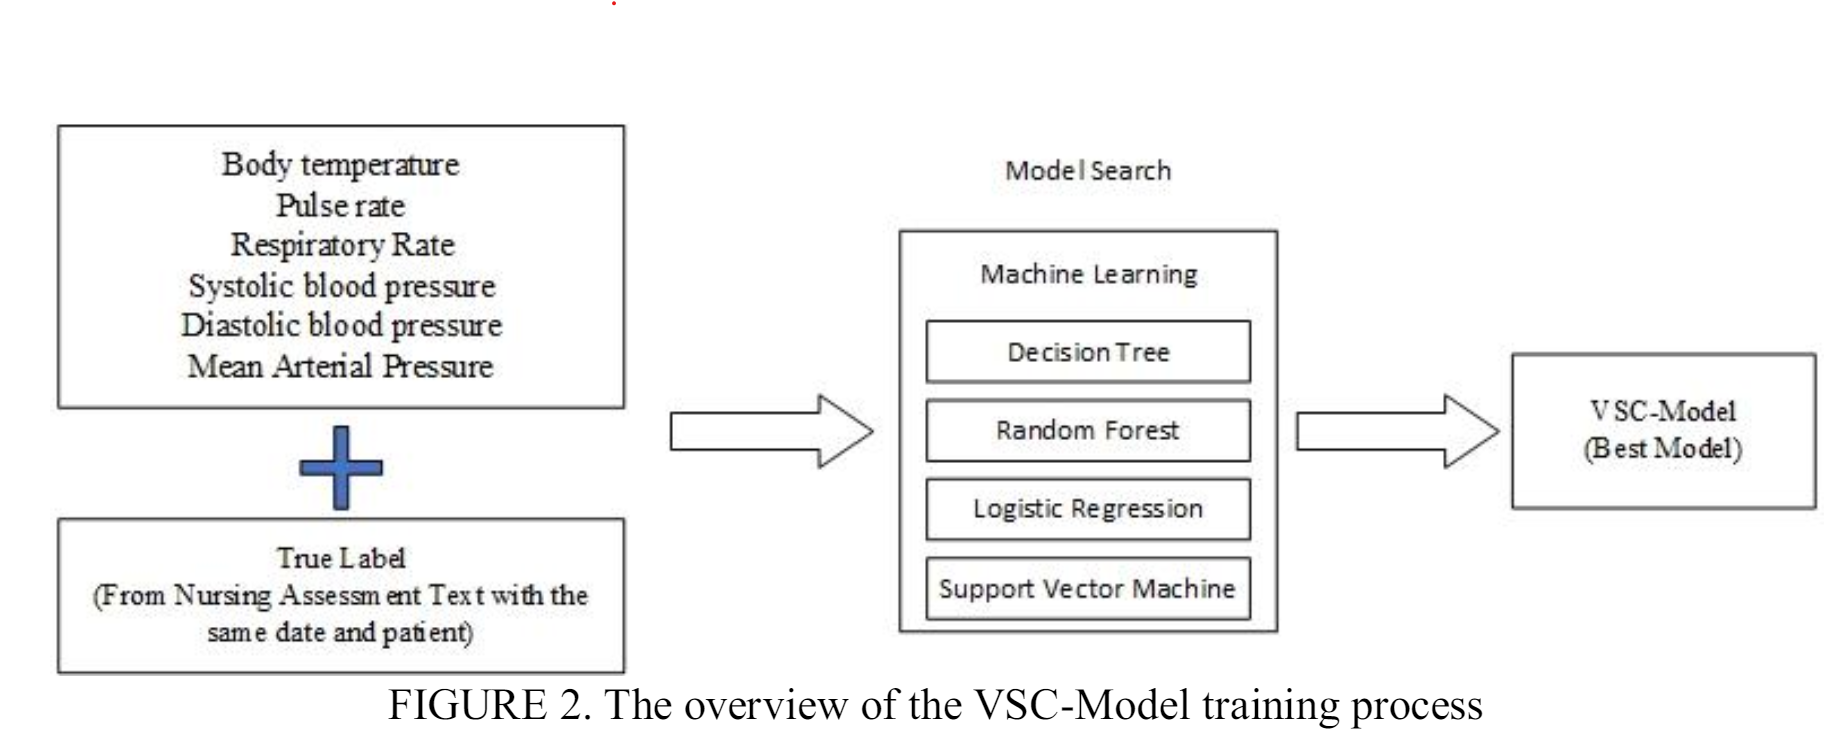
Figure 2 presents an overview of the process involved in training the VSC-Model. We conducted a model search to classify vital signs data by experimenting with four classification models: decision tree, random forest, logistic regression, and support vector machine (SVM). Each model was trained with specific hyperparameters using the training dataset and evaluated based on the accuracy of the testing dataset. The VSC-Model was trained using the merged dataset 1 which is the com
Pain Scale Classifier Model (PSC-Model) using Ensemble Learning
The PSC-Model is the improvement to the two previous models. We trained the two previous models (NTC-BERT VSC-Model) using the merged dataset 2. As already explain in previous section 3.3 and 3.4, the NTC-BERT will work using the text data while VSC-Model will predict the pain scale using the numerical data. The data used on both models are from the same patient.
The prediction results from each model are combined using ensemble methods. The ensemble method combines multiple learning models to make better predictions compared to a single model. The proposed combined prediction model is called the Pain Scale Classifier Model (PSC-Model). The PSC-Model model only works when nursing assessment text and vital signs data are available since the outputs from NTC-BERT and VSC-Model are needed in the ensemble method. Random forests algorithm is selected as an ensemble algorithm to combine NTC-BERT and VSC-Model. The outcome from the random forest is used as the PSC-Model's prediction. The PSC-Model is then evaluated using the test set to verify its performance.
Evaluation Metrics
Evaluation metrics play a crucial role in machine learning by providing a quantitative measure of the models performance. We use a range of evaluation metrics, such as accuracy, precision, recall, and F1 score, to validate the prediction results of our models. These multiple evaluation metrics allow us to assess the performance of the models from different perspectives, ensuring that we have a comprehensive understanding of how well they perform.
Our models are designed to predict three levels of pain scales. The evaluation metrics begin by calculating the values for True Positive (TP), True Negative (TN), False Positive (FP), and False Negative (FN). TP represents the number of instances correctly predicted to a specific class. In contrast, TN represents the number of instances correctly predicted as not belonging to a specific class. FP represents the number of instances incorrectly predicted to a particular class. Finally, FN represents the number of instances incorrectly predicted as not belonging to a specific class.
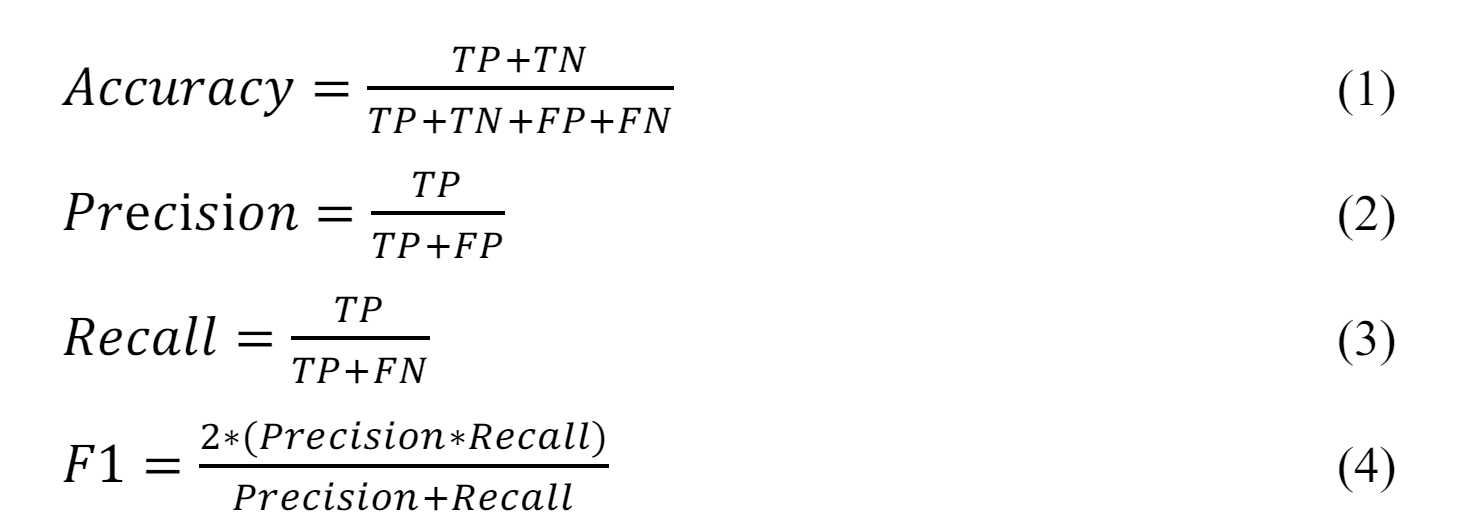
Accuracy (Eq. 1) represents the proportion of correctly classified instances out of the total number. It is commonly used to evaluate the performance of classification problems. However, our dataset has a slight class imbalance (the sample from the pain scale equal is >50% from the dataset). The accuracy might only reflect in some classes. We use Precision (Eq. 2) and Recall (Eq. 3) to validate the balance of the trade-off between FP and FN, and F1-Score (Eq. 4) averages Precision and Recall.
To summarize our methodology, we proposed three classification models to predict pain scale, which can be used in different environments for newly admitted patients with vital signs data from basic checking. VSC-Model can be used to predict the pain scale. After a skilled nurse checks and makes a note for the patient, we proposed NTC-BERT to predict pain scale from the nursing assessment text. Finally, PSC-Model is the improvement to the first two models. It incorporates ensemble learning to make the final pain scale prediction when both nursing assessment text and vital signs data are available.
Experimental Result and Analysis.
Our experiment was divided into three parts. The first part involved the NTC-BERT model, where different versions of BERT are tested to encode nursing assessment text and classify it into pain scales. The second part involved the VSC-Model, where we performed machine learning model search to find the best model for classifying pain scale based on a patient's vital signs. In the last experiment, NTC-BERT and VSC-Model are combined using random forests as an ensemble learning algorithm to improve the results from the two models and make the final prediction.
Nursing Assessment Text Classifier BERT (NTC-BERT)
In our experiment, we employed various versions of the pre-trained BERT model provided by Hugging Face. Table 2 presents the NTC-BERT results using different BERT versions for text encoding (the best results are shown in bold). After combining with a classification layer, the model using BERT-base demonstrates superior performance in terms of accuracy, recall, and F1-score. roBERTa performs slightly worse compared to BERT-base, while MacBERT yields the least favorable results.
| BERT-base | roBERTa | MacBERT | |
|---|---|---|---|
| Accuracy | 82.74% | 81.15% | 75.83% |
| Precision | 80.23% | 78.43% | 75.9% |
| Recall | 79.20% | 78.39% | 75.83% |
| F1-Score | 79.68% | 78.36% | 75.76% |
Taking BERT-base as the best model for NTC-BERT, Table 3 shows the precision, recall and F1-score for each category of pain scale. From the results, it is shown that the highest results are found in pain scale 1 with 85.41% precision, 88.07% recall, and 86.72% F1-score. The next best result is found in pain scale 0, while pain scale category two being the worst. As patients in pain scale category two require immediate attention and emergency handling as their condition is critical. A precision of 74.22% and recall rate of only 73.24% is not good enough, which shows that many patients have the potential to be misclassified and will not receive the necessary treatment.

Vital Signs Classification Model (VSC-Model)
In our experiment, a model search usint the training set was done on various machine learning models. The results of the experiments for VSC-Model are presented in Table 4 (the best results are shown in bold). The results from the experiment indicates that random forests outperforms other models in three evaluation metrics: accuracy, precision, and F1-score, while being the second best in terms of recall score. The result from the decision tree algorithm is slightly worse than the random forest, while Logistic regression and SVM both give low results and is not good enough to classify the pain scale from vital sign data.
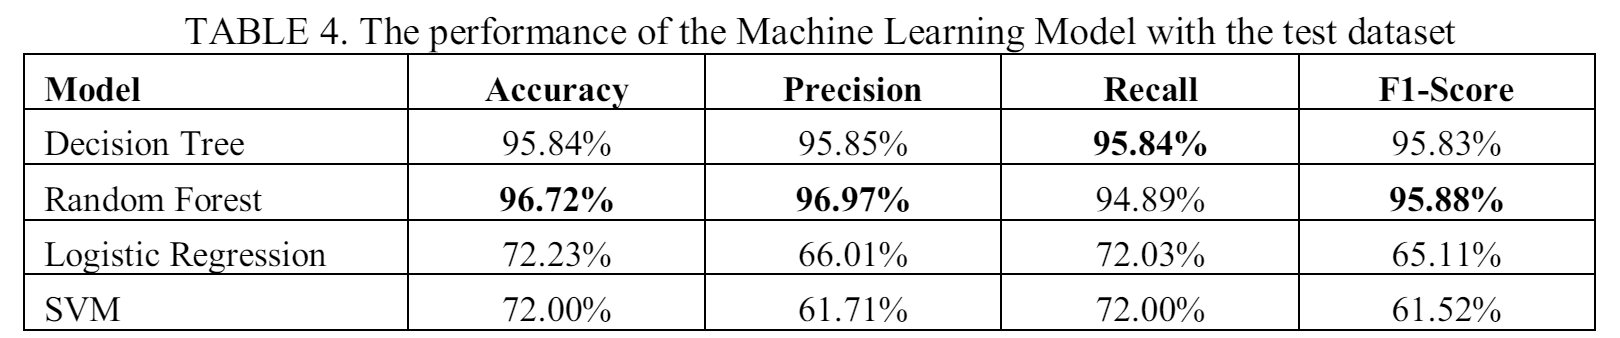
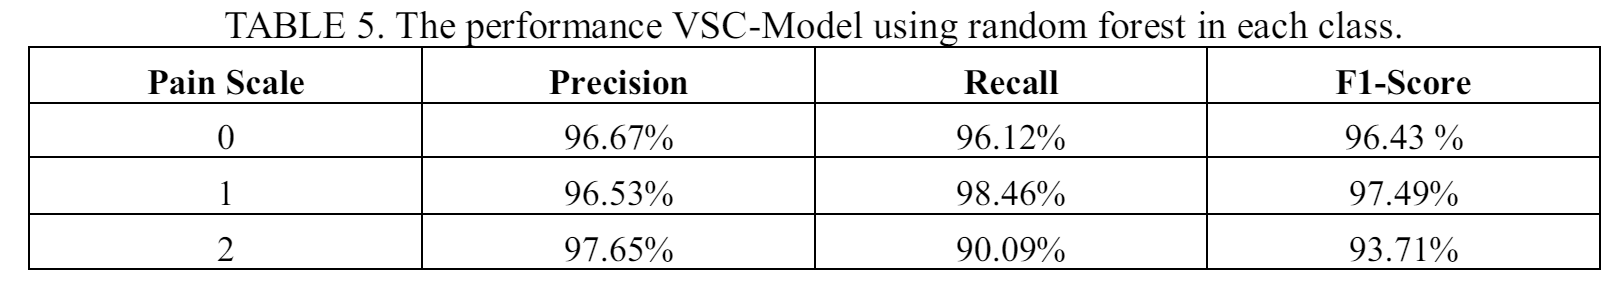
Table 5 presents the performance of the VSC-Model using random forest on predicting each pain scale. The model shows high overall performance for all three pain scales. However, the model shows lower recall score for a pain scale 2. The result indicates that the model tend to misclassify patients with pain scale 2 and can lead to wrong treatment by giving regular care programs to severely ill patients.
Pain Scale Classifier Model (PSC-Model)
From the previous two experiments, we got the best configuration for NTC-BERT and VSC-model. In the third part of the experiment, we combine the two models using random forest for the ensemble method. The output from the NTC-BERT and VSC-Model will be processed by the random forest get the final pain scale prediction for the patient.
Table 6 shows the performance comparison of the three models Model (the best result is shown in bold). The PSC-Model gives a very good performance with 99.45% accuracy, 99.54% precision, 99.16 recall, and 99.35 F1-Score. The result from the experiment shows the superior performance of the PSC-Model, which uses ensemble method, compared to the two separate models.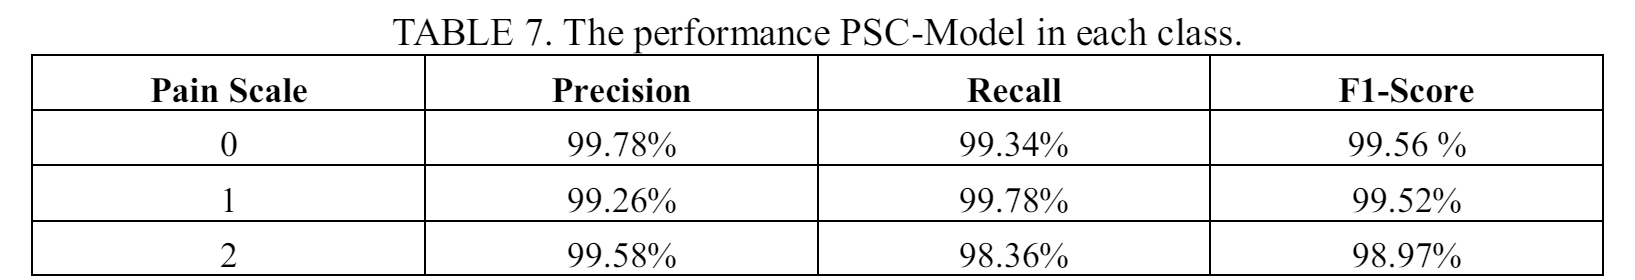
The prediction performance of PSC-Model for each separate class is presented in Table 7. The proposed method shows high performance for each class, which is close to 100% for pain scale 0 and 1, and only slightly lower for pain scale 2.
Result Discussion
After knowing the results of the experiment, in this section we will discuss about two important findings. The first is about the lower performance when predicting a pain scale 2 patient. The second is on how our proposed PSC-Model can improve the prediction performance compared to the separated model.
From all three experiments using NTC-BERT, VSC-Model, and PSC-Model, the results always show lower performance when detecting patient with pain scale 2. The result could be attributed to the lower data available for pain scale 2. In the merged dataset 1 which is used in VSC-Model and PSC-Model, only 1655 data of pain scale 2 are available from a total of 13188 records. While in the merged dataset 2 which is used to train the NTC-BERT, only 1120 records are of pain scale 2 from total 8261 records. The low number is also already a merged result from the pain scale 2 and 3 in the original dataset. The low performance shows that while pain scale 2 and 3 from the original dataset might corresponds to the same treatment action from the medical staffs, the features are not the same, which makes it difficult for the model to learn the pattern to make correct predictions. To improve the result, more data need to be collected for pain scale 2. It is even better if the dataset has enough data to train the model to predict the original pain scale 2 and 3, and let the medical professionals decide what actions to do for the patients.
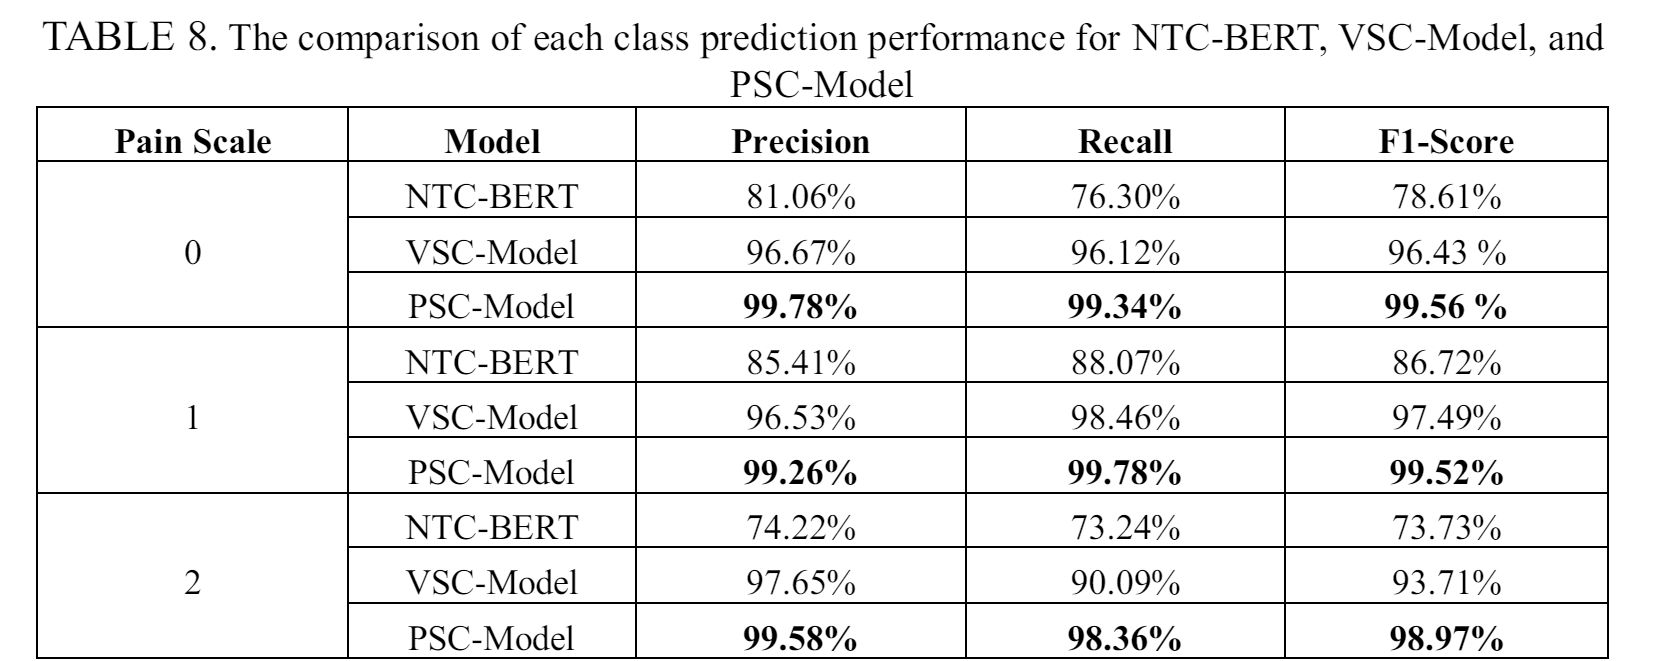
The result of the experiments display how the ensemble method can improve the pain scale prediction performance. Table 8 shows a comparison of prediction performance for each pain scale across different models. By using ensemble methods, our proposed PSC-Model give better prediction accuracy than the separated NTC-BERT and VSC-Model, particularly noticeable in the prediction of pain scale 2. This is especially relevant for NTC-BERT, which might misclassify a patient's pain scale, potentially leading to incorrect treatment. The only downside of the PSC-model is the need of both nursing assessment text and vital sign data before being able to be used.
Conclusions
Our study uses patient data from Taichung Veterans General Hospital in Taiwan to create the PSC-Model model for predicting pain scale. From the experiment, PSC-Model can achieve an very high score, nearing 100%, in predicting the pain scale from patient information. The dataset used for this study included mixed patient information, which comprised nursing assessment text and vital signs data.
To efficiently handle each data type, we devised three classification models: NTC-BERT, a Text Classification model, to predict pain scale from nursing assessment text; VSC-Model , to predict pain scale from vital signs information; and the PSC-Model , an ensemble learning algorithm, to integrate predictions from the first two models and produce the final prediction. Even with lower performance, both NTC-BERT and VSC-Model can accelerate the process of reviewing and categorizing pain scales for a patient. When a more comprehensive data is already collected, the PSC-Model can assign a more accurate pain scale for the patient.
Our high-performance models enable us to predict pain scales immediately after data collection, which can be used to assign different care programs to patients. The proposed method will reduce the workload of hospital staff by speeding up the patient information review process and prioritizing patient care programs effectively. The system can automatically generate pain scales in line with the daily workflow of skilled nurses, enabling early identification of pain and effectively alerting caregivers, all without increasing the nursing workload.
Moreover, our study demonstrates the potential of using mixed data types and ensemble methods to create a better classification model in medical applications, especially with text or documents requiring specialists to review and analyze. In our future work, we plan to increase the number of data to ensure better prediction accuracy. We also plan to experiment with newer technology, such as the GPT Model, and create a language model that can understand the context of nursing assessment or clinical notes, and recommend the response action in human language.